Matt Randolph
Amherst College ’16
Project Phases
My project consisted of three phases during the summer of 2014 that were not necessarily sequential, often overlapping and intersecting.
– Phase 1: Exploration Phase –
In the beginning of my Digital Scholarship Summer Internship, I spent my days exploring different digital tools and learning about the Kim-Wait/Eisenberg Collection of Native American Books. I read articles about the field of digital scholarship and each week the rest of my internship team and I would have a “sandboxing” period in which we’d explore and evaluate a particular digital tool, accessing its strengths and limits. By digitizing nineteenth-century letters containing Emily Dickinson’s poems, I gained an understanding and appreciation for the technical processes behind digitization and digital projects.
– Phase 2: Research Phase –
About halfway through the internship, I began engaging with primary sources and secondary texts in order to form research questions that could be approached using digital scholarship. In this phase, I thought critically about what kinds of digital tools could help answer, but I didn’t attempt to pick out specific tools. Although I hadn’t picked out a specific tool yet, I knew I wanted to make a digital storytelling project for the website.
From the beginning, I had a strong interest in the cross-cultural and interdisciplinary potential of the Kim-Wait Eisenberg Collection. Not only was it a valuable resource for Native American Studies from the colonial era to the present, but the collection also could draw connections between academic fields. With both African and Native American ancestry, Paul Cuffe Jr. could be appealing to a variety of scholars.
By the end of the research phase, I knew I wanted to bring Paul Cuffe’s story to life through digital technology, but I was conflicted on the right tool to do so. I ultimately decided that a geographic mapping project best reflected the nature of the maritime memoir. I didn’t just want to tell Cuffe’s story, I wanted to honor the geographic nature of the work by using mapping tools.
Perhaps, if I had more time, I could have continued to explore the possibility of “text-encoding” the narrative. I had already begun “pre-text-encoding” by marking up the text and identifying everything from places to chronological references to ship names using a combination of pens, pencils, and highlighting.
– Phase 3: Development Phase –
Toward the end of the internship, my work transitioned from exploring tools and texts to the creation of a final project. I knew I wanted people to experience a sailor’s travels at sea in a dynamic, visual way. However, I didn’t want to just make maps, I wanted an interactive experience- my map guides you on a journey but you can also explore particular moments more in depth by following links to the text. Some of the chapters also redirect you to relevant maps.
These features place the text and the map in direct communication with one another. Users have the opportunity to find locations in the text that interest them most by first exploring the work as a geographical and cartographic experience. On the other hand, those reading the narrative on our website first can then visualize the textual content they experienced to enhance their understanding and appreciation of the work.
Using ArcGIS Online
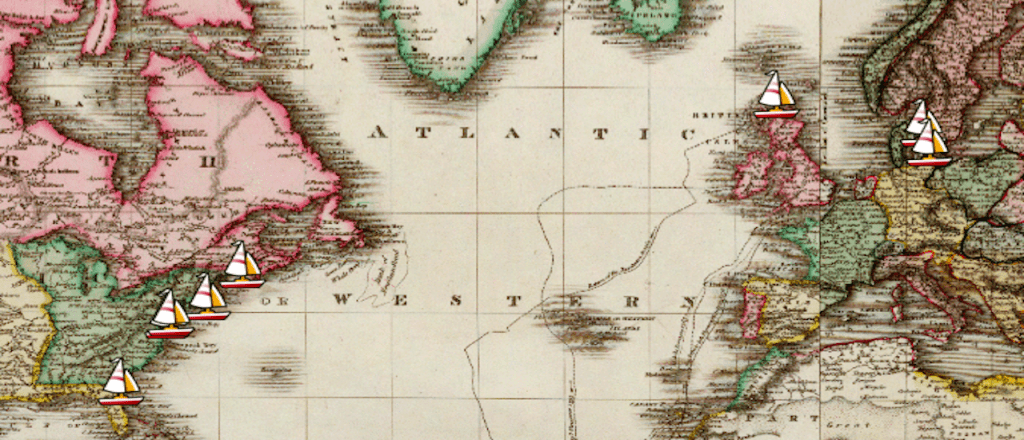
My five maps for Paul Cuffe Jr.’s journeys were developed using ArcGIS Online. I used a freely available, geocoded map of the world in 1812 from the David Rumsey Historical Map Collection to make the project more chronologically accurate than using a contemporary map. I plotted points based on references to place in the narrative. With ArcGIS Online, it is also possible to change the symbol for a map point (in the image above, you can see that I used a sailing boat).
In addition to assigning excerpts from the text for particular map points, I sometimes included images or links within the pop-up windows for the map points. The links often directed users to external resources to provide contextual information about a particular text except.
Clearly, ArcGIS Online could be adapted to a variety of scholarly needs, from plotting the journey of a world traveler to plotting the locations of battles during the Civil War. Please continue to explore the gallery of example projects available on the ArcGIS website if you are interested in developing your own digital mapping project.
Resources
These are some of the academic resources gave me insight into the lives of Paul Cuffe Jr. and his father.
- The New Books Network: Jace Weaver’s The Red Atlantic: American Indigenes and the Making of the Modern World, 1000-1927″ (University of North Carolina Press, 2014)
- A Summary of Paul Cuffe Jr. from BlackPast.Org
Summer Blog Posts
Throughout the summer, the other interns and I wrote blog posts to reflect on our experiences exploring the field of digital scholarship. Click here to check it out.
Please send any corrections or questions to Digital Programs at libdig@amherst.edu
