Digital Humanities/Digital Scholarship: the dynamic field from which a community of digital humanists (or DHers) has emerged, with the distinct emphasis on inclusivity and freely sharing resources. “Digital humanities” originally specified statistical methods of looking at word frequencies but has since expanded into a diverse set of research and instruction techniques including, but not limited to
- Text Mining
- Information Visualization
- Text Encoding
- Digital Archives and Preservation
- Computational Linguistics
- Geospatial Analysis
- Crowdsourcing
(Gold, Matthew. “Digital Humanities.'” The Johns Hopkins Guide to Digital Media. Ed. Marie-Laure Ryan, Lori Emerson, Benjamin J. Robertson. Baltimore, M.D: Johns Hopkins University Press, 2014. 143-147. PDF.)
Data Visualization: sometimes overlapping with “graphs,” data visualizations are representations of text, data, imagery, or other subjects of study in ways that reveal new trends, investigate a hypothesis, or simply make a more attractive and useful presentation. This can be as simple as a word cloud or as complex as network analysis.
Digital Storytelling: Storytelling using digital tools, often published online and sometimes trying out nonlinear ways of storytelling. Check out these projects using the program Scalar, including a project on stories of Native Americans who were photography subjects or the stories around Martin Luther King’s speech.
GIS (Digital Mapping): “a geographic information system (GIS) lets us visualize, question, analyze, and interpret data to understand relationships, patterns, and trends.” (Visit http://www.esri.com/what-is-gis for more information.)
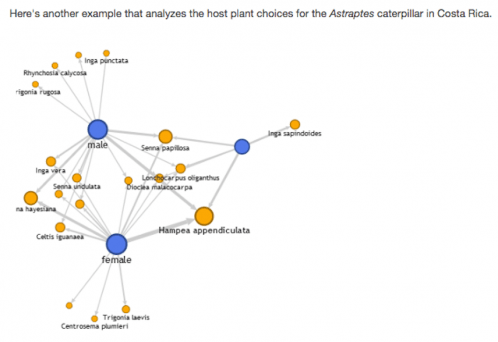
Network Analysis: Identifying and measuring the strength of connections between topics, words, or other parts of a data set, whatever that data set might be. Try out your own network analysis in Google Fusion Tables where you can find a network graph we referred to as “Google Squids”
Text Analysis: using digital tools and data visualizations to explore texts, display them, or represent them. This can include tracing word frequencies across chapters or creating word clouds to represent word frequency.
Exploration Tools: best for trying to feel out what trends are in your material, these kinds of digital tools allow you to experience how data or information could be analyzed or represented, but lack customizability.
Digital Archive: a repository of digitized material, often an accessible collection of images from letters, books, print material or photographs of less planar materials. Digital archives are typically less curated than a digital exhibit, so materials are meant to be searched for or browsed but not necessarily telling a story.
Digital Exhibits: the evolution of the museum exhibit, digital exhibits can seem like walking through a museum with a “Next” button, or they can be flush with graphs and interactive tools, but many of them try to use the digital medium to tell a story or present an argument they wouldn’t be able to create in print.
Digitization: the creation of digital files representing a physical object. After capturing the physical object, often through photographs or scans, digitization (or digitizing) includes processing in tools like Photoshop to adjust the colors. National standards specify resolution and proportions for images.
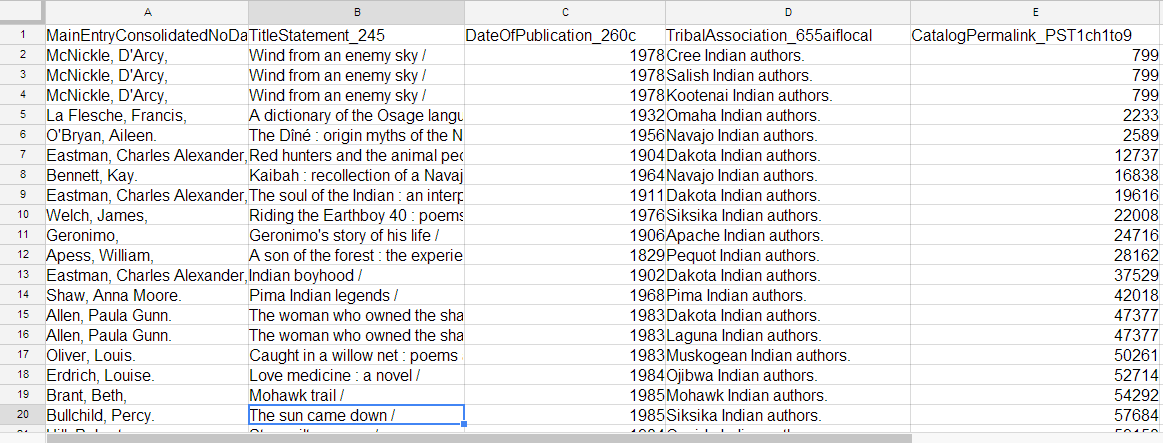
Metadata: literally data about data, this category includes the listings in library catalogs for authors and place of publication, and are extremely important in being able to search within records when you don’t know exactly what you’re looking for. Standardization of metadata terms is also an important consideration, so that a search for “New York City” doesn’t miss all records listed as “New York, N.Y.”
CSS: also maintained by the W3C, CSS works in tandem with HTML, XML to specify how tagged words in the HTML are displayed on each page further (font, color size for each header or link already named). Present on almost every web page, CSS is important for any project destined to be online. CSS stands for “cascading style sheet.”
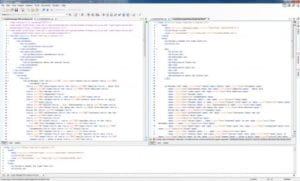
HTML: the language of the internet – maintained by the W3C (World Wide Web Consortium), HTML allows all browsers to display text and images in a particular style (headers, paragraph, bold, italics, links) by standardizing the code; stands for “hypertext markup language.”
Text Encoding(TEI): adding descriptive codes to textual data to enable a computer to process that text (descriptive codes could relate to metadata (which provides additional detailed information about the text) or by characterizing the roles, purposes, or qualities of the text through a markup language like XML).
XML: not a replacement for HTML, this markup language can also be very important to DH programs; in short, XML is used to describe more about what particular parts of a document are, instead of how to display them on the web. XML might be used to show which part of a document is the “body,” which the “preface,” or who is speaking at each line in a play. XML stands for “extensible markup language.”
Crowd Sourcing: obtaining services, creative input, or content for a particular task or project through a group of people or community that were initially unaffiliated with the project or task (especially an external, online community)
Open Source: describes a digital software that makes its source code freely available to others for modification and distribution (unlike commercial software).