Below, I’ve broken down the phases that directly went into my digital humanities project and have also included some mention of how long things took, which may be of use for students planning their own DH projects. It’s worth noting that these phases were not mutally exclusive to each other. There were times, for example, when secondary tool research would overlap with data clean up and even analysis.
My interests in the Kim-Wait Eisenberg collection (KWE collection for short) and in different digital tools changed a lot over the summer. This early exploration and research was important because it indirectly influenced what I eventually did even if it didn’t directly show up in the final product. For a more detailed explanation of this early research and thinking phase, take a moment to check out this post from the Amherst College Digital Scholarship blog.
Phase 0: Research Questions (10-14 days)
Before I started, I needed to have some idea of what I was going to do. I needed to have more than just a general interest in a topic or in my case, the particular books I had come across. This also meant coming up with one or more guiding questions to pursue as the focus of my project.
- I read David Cusick’s Sketches of Ancient History (1827), read secondary research of Cusick.
- I came across Elias Johnson’s Legends, Traditions, and Laws of the Iroquois (1881), another book in the KWE collection which contained a similar creation story by a member of the same tribe as Cusick.
- I had conversations with Amherst faculty and staff about how to build a project around research questions.
Phase 1: ‘Data’ Cleanup (4 days)
After the research phase, I broadly knew I wanted to compare the writing style of David Cusick and Elias Johnson, two Tuscaroran 19th Century authors who wrote creation stories of the Iroquois people. Specifically, I wanted to see how they emphasized place and geography differently through text analysis. To do that, I had to get text files of their works to input into any of the analysis tools or programs I would eventually use.
- I found digitized versions of Sketches and Legends at archive.org and copied plain text files of Sketches and just the creation story section of Legends since Johnson’s text has many other sections in it.
The plain text files from archive.org for both versions had OCR transcription errors, meaning the software that transcribed the text from the picture of the original documents didn’t recognized certain characters and misspelled some words. This led to some funny mistakes like ‘Fart III” instead of ‘Part III.’ On top of that, there were many spelling inconsistencies in Cusick’s original text (names and places spelled differently in particular). Here’s a good example of such variations from Sketches:
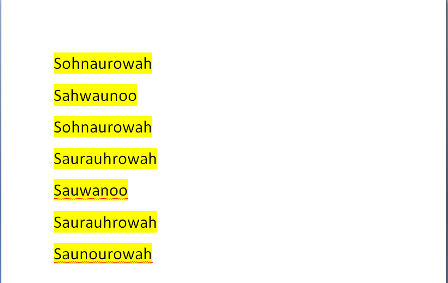
- To clean up these inconsistencies, I corrected typographical errors and normalized spellings by hand and by using Microsoft Word spell checker and find and replace searches.
Going into this project, I didn’t really expect to have to deal with this type of issue, but when it came up, I couldn’t move forward until I solved it. As a result of the admittedly tedious data cleanup, I spent a lot of time getting familiar with the text. I don’t think I would have had as strong a sense of the book I was working with if I didn’t have that time with it. And the more I did know about my subject matter, the better informed my project became.
Phase 2: Tool Exploration/ Early Testing (5 days)
With ‘cleaned’ text files, I went about finding easy to use text analysis tools to start seeing what my ‘data’ could reveal. I found a suite of text analysis tools from taporware on the website tapor.ca to be particularly useful.
- Because I was interested in comparing how Cusick and Johnson talked about place and geography, I used concordance and summarizer tools to try to extract that information.
- I made a table of place names and words in context from the concordance tool by inputting the creation story text files and having the tool search for and then display just those place names.
- I input the same texts into the summarizer and got it to display more general information in table format- things like the most frequent words and word counts, words that appear in high concentrations near each other.
Phase 3: Analyzing Results/Changing Research Question (5 days)
I wasn’t finding any significant information and place or geography from the text and tools I was using.
- Using the same text analysis tools, I was unable to highlight or extract descriptive information about places in these creation stories.
- I changed my research question to focus not geography but on the events that took place in both Cusick and Johnson’s texts and how they structured those events differently.
Phase 4: Part of Speech Tagging Tool Research (2 days)
After a conversation with Aaron Coburn (Amherst College IT staff member) about text analysis and natural language processing, I went to find POS tagging tools that would be able to highlight various parts of speech.
- My research revealed that POS tagging tools had a steep learning curve for someone unfamiliar with programming or otherwise had poor user interfaces.
- I found a user-friendly tool for tagging and displaying marked up parts of speech- but it failed to work for me.
Phase 5: Marking up Text (2 days)
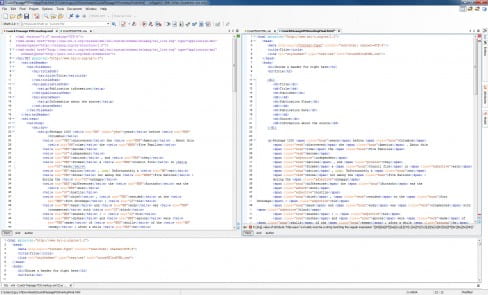
After a meeting with Sarah Walden (Amherst College Digital Projects Librarian), I decided to forgo POS tagging tools and to ‘markup’ parts of speech myself using XML and analyze highlighted parts of speech from there. Marking up speech basically means defining digital text so you can do something with it. (ex: <i>italics</i>= italics in HTML, <w ana=”nns”>italics</w> in XML as used in my project marks italics as a plural noun. For a clearer sense of what my encoding looked looked like, visit this page to see an early iteration of the XML file I used to create the color-coded passage.
- I shifted away from a comparison of two texts I had been planning to use and focused on a passage (<500 words) from Sketches that I thought was interesting (a paragraph detailing the formation of the Iroquois Confederacy)
- I used XML to tag the following parts of speech that I chose to highlight: nouns/pronouns, verbs, adverbs, adjectives.
- With the help of Sarah Walden, I was able to create an HTML version of the formation passage with color coded parts of speech that would allow me to observe trends in the writing.
Phase 6: Analysis and Write up (3-4 days)
Once I had enough information and details picked out to talk about, I began writing my short ‘essay’ on what I found.
- I studied the marked up passage.
- Initial observations were tested in text visualizations tools like the concordance tool mentioned above and a wordtree that nicely displayed all instances of a word phrase that I searched for.
- I wrote up my analysis from the marked up passage as well as accompanying background information.